
Recent Articles
Categories


Introduction
If you ask New Brunswickers to tell you about their province, they might talk about the beautiful forests, fresh seafood, covered bridges, and a slower, more pleasant way of life.
On the surface, these are all elements that define the New Brunswick that we know and love. However, they are also elements that play a key part in the provincial economy – something you are less likely to hear about. From our small population to our natural resources and beyond, New Brunswick relies on growth in many different areas to boost its economy and ensure the progress and prosperity of its people. These issues impact every New Brunswicker, but the general population might not have direct access to information on the province’s economic indicators or know how to interpret them. This is a problem that we tried to address this summer.
From May to August 2020, we (Aya Benotmane and Thomas Campbell) worked as Data Analysts through the Pathways to Professions program at the University of New Brunswick. Pathways to Professions (P2P) is a 13-week experiential learning program developed by the New Brunswick Institute for Research, Data and Training (NB-IRDT) that gives UNB students the opportunity to work as part of a research team while attending training sessions on research methods and job readiness skills.
We both applied to the program in hopes of learning more about research and data, and both landed roles as Data Analysts. As a part of this, we attained and analyzed statistical data on various economic measures to quantify New Brunswick’s economy through a research project called BoostNB.
About BoostNB
BoostNB is a student-led project that analyses New Brunswick’s past and present economic performance in an effort to rate whether the province is progressing towards recommended economic goals in various areas (or not). BoostNB makes information about New Brunswick’s economy accessible and publicly available, and the findings provide evidence that can also be used in policymaking.
This project is modelled after Nova Scotia’s economic dashboard, OneNS, and has been ongoing since 2018 under the supervision of Dr. Herb Emery, the Vaughan Chair in Regional Economics at UNB. The purpose of BoostNB is to gauge the progress of New Brunswick’s economy through the analysis of various economic indicators that are represented as provincial goals – for instance, through a review of various sources, the BoostNB project uses an interprovincial migration goal for New Brunswick of an average net gain of 800 working-age persons per year.
We calculated the province’s progress toward reaching these goals using open source data from Statistics Canada, as well as a variety of other provincial sources. To help make our findings accessible to a wide audience, we prepared deliverables in the form of graphs, research reports, and infographics (all of which are available at www.boostnb.com). We presented our results and a discussion of the potential implications to stakeholders (business leaders, government officials, and academics from across New Brunswick) at our final P2P presentation in August of this year.
BoostNB measurements are updated each summer by various students in New Brunswick, requiring each cohort to understand and analyze previous students’ work while also ensuring the convenience of the future students which the records have to be transferred to. Each year’s work builds on the work of students from all previous years. This has been a difficult process in the past for a number of practical reasons, but we tackled the issue in a new way this year by implementing automatic database updates through Excel. This change will help to save future students’ time in this area at least, as they will no longer have to manually input data.
Key Findings
The entire list economic indicators we explored, as well as New Brunswick’s progress toward meeting these economic goals since 2018, is presented in the visual below:

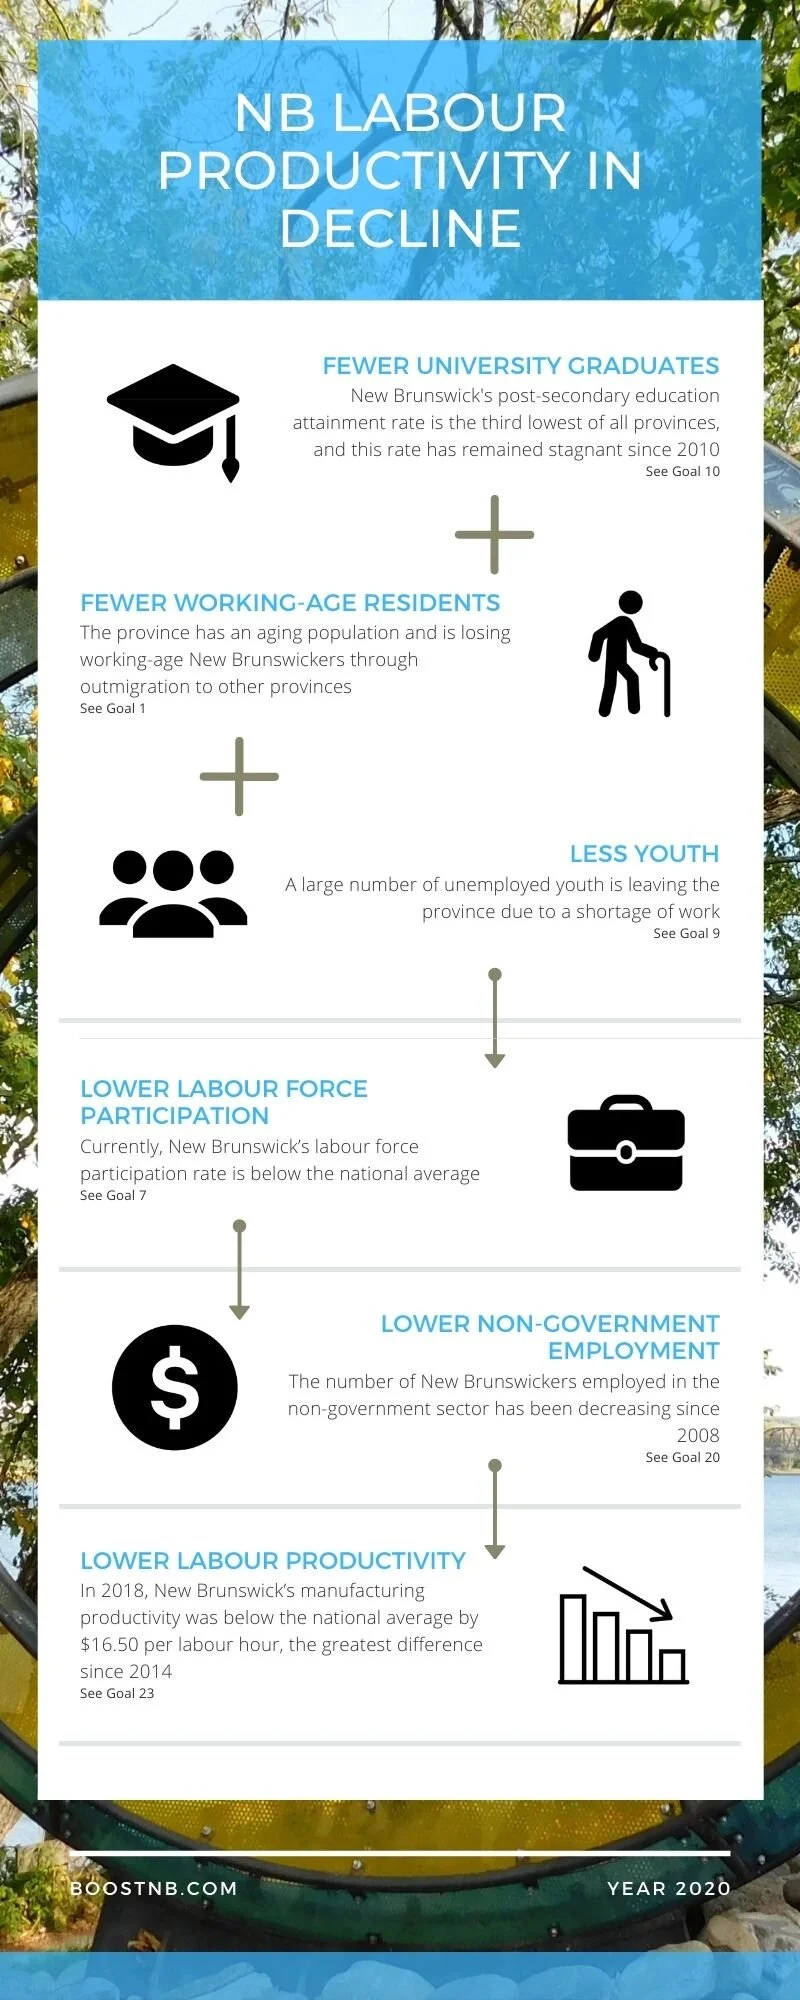
Some of the economic indicators we found that are not progressing include international immigration, interprovincial migration, post-secondary education and training, youth employment, and labour productivity. These goals are particularly relevant for young people, and the infographic below shows how they are all connected:
Other economic indicators not progressing toward their goals include value of exports, mining in New Brunswick, tourism expansion, and private-sector employment.
There is currently a low number of New Brunswick businesses participating in foreign export trade. This is partly due to the near disappearance of the province’s mining industry, which was once globally renowned. It has, however, more recently struggled due to environmental protests and the declining global market value of minerals. Tourism in New Brunswick has also been unstable in recent years due to rising gasoline prices and increasing exchange rates (not to mention COVID-19 during the summer of 2020, which will be accounted for in future years’ data). Additionally, data reveals that the number of New Brunswickers employed in the non-government sector has been declining since 2008, which is due to the 2008/09 economic recession that resulted in high unemployment rates in the province and across the country.
On a positive note, other areas have been progressing toward their goals tied to economic growth. These include fisheries and agriculture, the real non-residential private sector, forestry in New Brunswick, real GDP growth, and net debt-to-GDP ratio. The total value of New Brunswick's exports has more than doubled in the past ten years. This increase is largely attributed to the Seafood Production and Packaging sector, which makes up nearly 70% of the export value in the province. Real non-residential private sector investment has overcome its decline following the economic recession, and so it was found to be progressing. The forestry industry took a downward turn after large changes in the industry, but in recent years the labour participation and overall GDP contributions have been increasing. According to the data, the net debt-to-GDP ratio has been decreasing in the past few years after several years of increase, which is a good sign for the future of debt in New Brunswick.
Conclusion
These insights are just a selection of results and discussion generated by our 2020 BoostNB analysis. Comprehensive summaries of all the goals are available at www.boostnb.com in the form of individual reports and infographics. The reports were written for public consumption, meaning they are concise and tailored to a broad audience.
Having knowledge of the various economic factors at work in an individual’s life can make them feel more connected to the areas where they live, work, play, and ultimately call home. This is of relevance to young people who are looking for educational and employment opportunities. In terms of business and government decision-making, the research findings serve to encourage evidence-based policy making when it comes to key topics like education, employment, natural resources, and investments. As students who knew little about the New Brunswick economy before P2P, we believe the information being discussed on the BoostNB dashboard and beyond is of the upmost importance to making personal and policy decisions alike.
Of course, no research study is without its limitations. For our work this summer, one of these limitations was the inability to access the UNB campus and work in the NB-IRDT facilities due to COVID-19. As a result, we were restricted to working remotely and collaborating through email and video conferencing technology while using open source data. When data was unavailable through Statistics Canada, a variety of other open source sites had to be explored to find ones that had reliable and relevant data. This was not always a straightforward task.
Although the BoostNB project already touches on several economic indicators, we have recommendations for future students and future project iterations, such as further investigating consumer activity, the energy sector, and the construction sector. Indicators within consumer activity, such as retail trade, motor vehicle sales, and the Consumer Price Index can demonstrate what drives consumption. Since several production and consumption activities require energy as a fundamental input, natural gas prices and oil production could also be relevant indicators of economic growth. Finally, the construction industry is related to businesses in numerous industries, and thus, when construction is delayed or unexpectedly halted, businesses across industries feel the consequences. As such, we also recommend exploring building permits and investments in the construction industry to measure economic growth.
Note to Students
Overall, Pathways to Professions was an enriching experience that provided numerous learning opportunities. The NB-IRDT team, as well as Dr. Emery, were very approachable and provided regular check-ins with the students to address any questions or concerns. As the program comes to an end, our takeaways are not to be afraid to ask for help and be open to learning new things, and to get invested in your work to be able to fully understand and enjoy it. If you are interested in having a summer like we did, keep your eyes open for P2P’s applications for summer 2021, available early next year!
*This article was written with assistance from UNB student Noubahar Hasnain, Communications Coordinator for the 2020 Pathways to Professions team.
Authors


Featured Researcher
